Validation
An extensive series of validations were carried out by comparing model results with measured wave data at various locations in the Pacific Ocean. The wave model was not calibrated against available measured data, and measured data has not been assimilated into the hindcast.
An assessment of hindcast skill was carried out using a variety of measure, including:
- Statistical Measures: Se consideraron valores estadísticos tales como sesgo general, diferencias en al cálculo del error medio de raíz cuadrada (RMSE), índice de dispersión (SI), índice de dispersión sin sesgo (SIB) y la correlación entre las mediciones y los datos del hindcast.
- Time Series Plots: Visual inspection of time series plots was carried out.
- Q-Q Plots: Quantile-Quantile plots were prepared and reviewed. These are plots of the corresponding wave heights in both the measured and hindcast data sets at equivalent values of cumulative probability.
DATA SETS USED FOR WAVE PARAMETER VALIDATIONS:
Topex/Poseidon Altimeter Measurements.
Table1 below provides the summary statistics for comparisons against altimeter wave measurements from the Topex/Poseidon satellite (1992-present) for the locations shown in Figure 1. Appropriate corrections to the Topex data have been carried out to adjust for instrument drift and sensor changes, as per the technical literature.
Pacific Ocean Wave Buoys.
Tables 2 and 3 provide summaries of the statistical comparisons between the hindcast and various wave buoy measurements in the North and South Pacific. The buoy locations are shown in Figure 1.
Valparaiso Wave Buoy
Comparisons were also carried out against measured wave data at Valparaiso (TriAxys buoy, November 2000 to January 2004 with gaps in coverage). Comparison plots showed a bias in significant wave height of 0.13 m for the hindcast, with an associated scatter index of 0.23 and a correlation of 0.73.
However, it is important to note that the TriAxys buoy is not located in deep water, and only a very simplistic methodology (Snell's Law) was carried out to transform the deep water hindcast data to the buoy location .
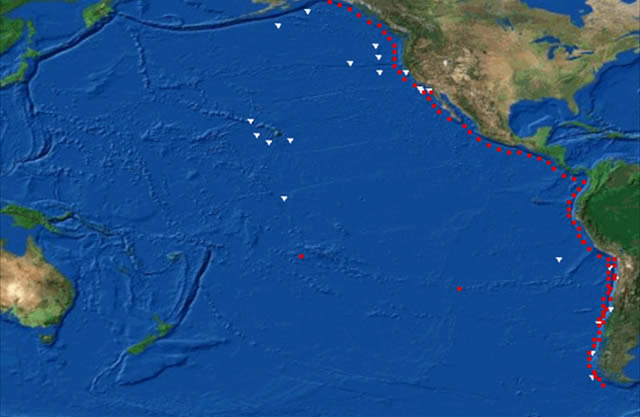
![]() Buoy/Topex locations
Buoy/Topex locations ![]() Data locations along American coastline
Data locations along American coastline
TABLE 1
Summary of Comparison Statistics for Significant Wave Height at Selected Topex/Poseidon Crossover Locations.
| Location | Bias (m) |
RMSE |
Scatter Index |
Scatter Index Bias Removed |
Correlation |
|---|---|---|---|---|---|
| TOPEX01 | 0.00 | 0.82 | 0.19 | 0.19 | 0.84 |
| TOPEX02 | 0.18 | 0.66 | 0.18 | 0.18 | 0.85 |
| TOPEX03 | 0.10 | 0.53 | 0.18 | 0.17 | 0.84 |
| TOPEX04 | 0.05 | 0.55 | 0.21 | 0.22 | 0.73 |
| TOPEX05 | 0.04 | 0.42 | 0.20 | 0.19 | 0.73 |
| TOPEX06 | 0.12 | 0.36 | 0.18 | 0.16 | 0.79 |
TABLE 2
Summary of Comparison Statistics for Significant Wave Height at Pacific Ocean Locations.
| Buoy Location | Bias (m) |
RMSE |
Scatter Index |
Scatter Index Bias Removed |
Correlation |
|---|---|---|---|---|---|
| Point Reyes | -0.08 | 0.56 | 0.22 | 0.21 | 0.87 |
| NOAA 32302 | 0.01 | 0.32 | 0.15 | 0.15 | 0.85 |
| NOAA 46006 | 0.19 | 0.58 | 0.20 | 0.19 | 0.95 |
| NOAA 46059 | 0.21 | 0.51 | 0.19 | 0.17 | 0.95 |
| NOAA 46066 | 0.15 | 0.61 | 0.21 | 0.20 | 0.93 |
| NOAA 51001 | 0.02 | 0.43 | 0.17 | 0.17 | 0.90 |
TABLE 3
Summary of Comparison Statistics for Peak Wave Period at Pacific Ocean Locations.
| Buoy Location | Bias (s) |
RMSE |
Scatter Index |
Scatter Index Bias Removed |
Correlation |
|---|---|---|---|---|---|
| Point Reyes | 0.95 | 3.32 | 0.31 | 0.29 | 0.50 |
| NOAA 32302 | 0.43 | 2.96 | 0.23 | 0.23 | 0.39 |
| NOAA 46006 | 0.13 | 2.80 | 0.25 | 0.25 | 0.55 |
| NOAA 46059 | -0.13 | 2.65 | 0.23 | 0.23 | 0.63 |
| NOAA 46066 | -0.18 | 2.66 | 0.26 | 0.26 | 0.53 |
| NOAA 51001 | -0.01 | 2.57 | 0.24 | 0.24 | 0.62 |
Home | Hindcast | Wind Field Generation | Validation | Acquiring Wave Data | Contact us, downloads, links
A joint project by the Hydrographic and Oceanographic Service of Chile (SHOA) and Baird & Associates Coastal Engineers Ltd.